Plotting sparse prometheus data in grafana without missing values
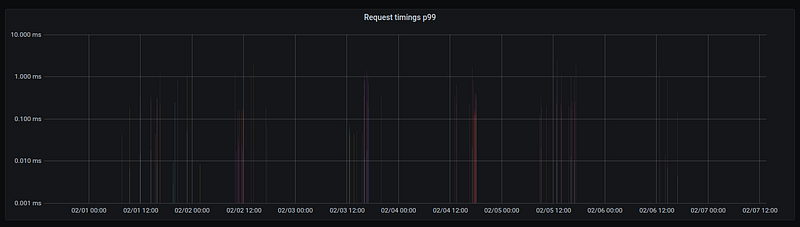
Grafana panel with sparse data over 7 day period
The problem
Note: You’re probably here because you already read the forums thread on top of Google but it seemed confusing, and you weren’t sure if max interval exists yet. If you’re just looking for a fix, scroll to solution, otherwise, feel free to read up for some background!
Recently, I had to work with a Grafana panel that looked like the above. But what are we looking at here?
First off, this graph shows the response times for requests on an API that we manage at Thalatta. You’ll notice that the Y axis is logarithmic, which I’ve found to be helpful when plotting API timings — some endpoints tend to be significantly slower than others.
But the real catch is that the data is fairly sparse and comes in bursts. Notice how thin the lines are? The above is a 7 day view, let’s zoom in at the center and see what it looks like.
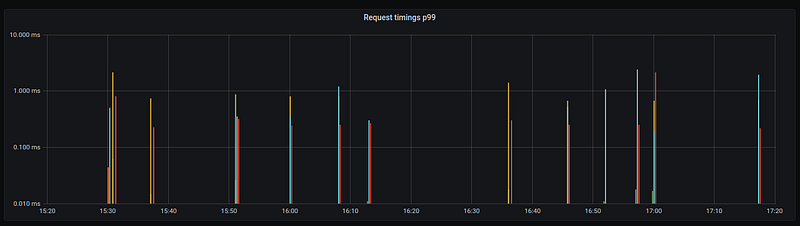
Grafana panel with sparse data over 2 hour period
A somewhat common problem with sparse data in Grafana, which we hit as well, was that you may, well… lose it. But why?
Background
Grafana plots the data from its various datasources onto the panels. In the case of a Prometheus datasource, Grafana executes a query to the Prometheus API with a lot of autogenerated optimizations. Those optimizations are meant to strike a balance between seeing enough beautiful data in your monitor and seeing it fast enough.
The Prometheus data is already somewhat discrete. Most Prometheus jobs pull in data every 15 or 30 seconds, which means that your data points are clustered around those periods. As a consequence, during the time intervals between the clusters (so think of second 1–29 in the clock), there isn’t a lot of data.
As you can probably infer from the above already, we can use our knowledge of this “interval” to optimize a lot, both for speed and for quality. For example, if I know that the Prometheus scraper pulls data every 30s, when requesting data over 5 minutes, I can limit the maximum results to 10. But what if the first data point cluster already has 10 data points? Well, then I can request that the minimum interval between results is at least 25s.
Grafana does a lot of optimizations about the interval, much more than we can capture here. But these optimizations have some weaknesses with sparse data. In particular, consider the following scenario:
- My Prometheus server has two scrapers, A and B
- The default scrape_interval is 15s
- A uses Prometheus Blackbox Exporter to verify if a service is up, every 15s
- B scrapes my application for exceptions, every 15s
- I get application exceptions about once every 6 hours
Now, obviously if you need to plot the above, service A will have consistent results over time, so it’s easier to reduce the amount of data points and still maintain accuracy. But in the case of B, if you somehow miss the 1 data point in 6 hours with the actual data, you’ve completely destroyed the accuracy of the graph! Of course an automatic tool is unable to know this, so we need to manually configure our system.
Solution
Max interval doesn’t seem to exist yet, or if it does, I haven’t found it in the current latest Grafana (7.4).
However, Grafana is fairly customizable on its query options, which have strong autogenerated defaults
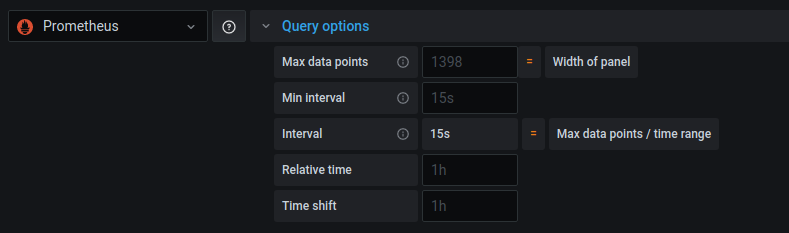
Prometheus query options for a Grafana graph
The max data points default value is chosen based on the width of the panel, since you can’t plot more than 1 data point per pixel.
Increasing your max data points to a pretty high value and keeping all other settings intact will generally allow you to plot your sparse data. In my case, I’ve set it to 10000, which is about 5 times higher than the autogenerated value.
This will work for a lot of the base cases, though not all. More specifically:
- You need to have a default min interval configured properly in your data source.
- The high max data points are not evil in this case, because the entire point of sparse data is that you don’t have too many data points. Still, make sure not to accidentally use other queries with this super high value!
- Interval is calculated based on max data points/range, so the bigger the time range you want to plot, the more max data points you will need. In our case, our max data age is 30 days and our min interval is 15s. If I want to force the interval to never miss a value for these, I should use 172800 (15s intervals in 30 days). But my data is not that sparse (it sticks around for a few scrapes) and this panel is usually examining a time range of up to one week, so I’m okay with an order of magnitude lower (~10000).
To reiterate: this is by no means a perfect solution, but for many use cases, it will be good enough. The more you study and understand your data and these monitoring systems, the better you will get at configuring the right values.
Happy plotting!
#articles